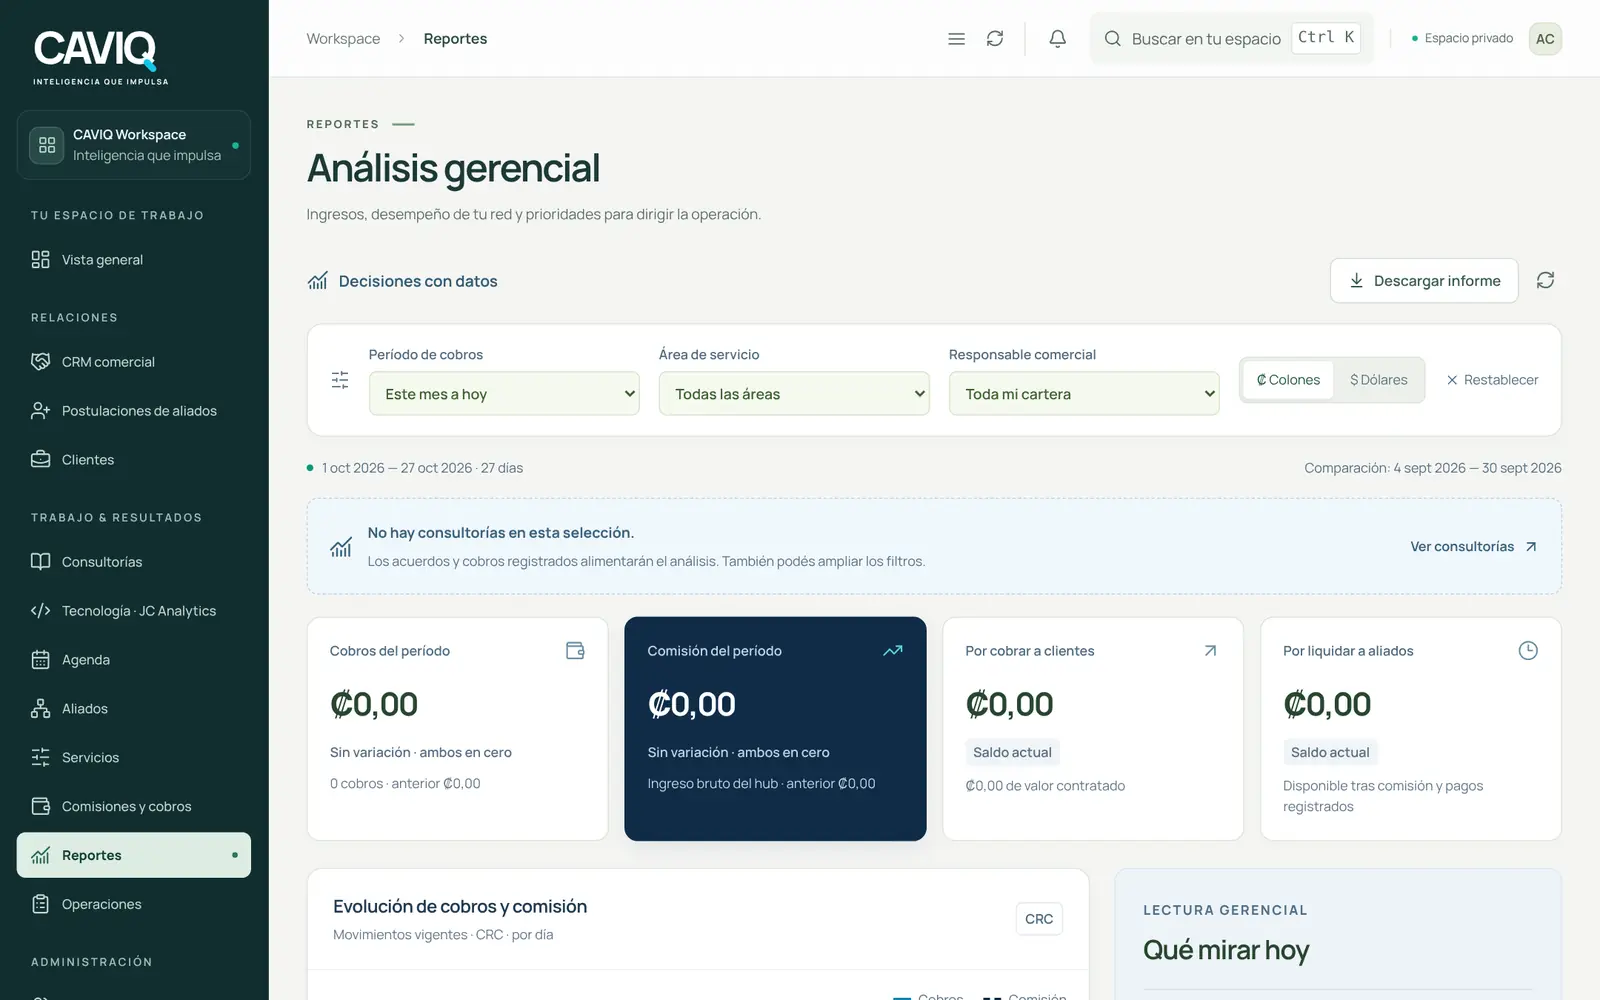
Power BI dashboards for decisions that cannot wait.
Turn scattered business information into a shared view of performance, with clear definitions and ownership.
Starter dashboard
$135one-time + tax · ≈ ₡70 000
- Delivery: 1–2 weeks
- 30 days of support included
- With AI: $270 total
The message is ready with the package. If you tick signals or use the calculator, they go in the message too.
The power ofseeing clearly.
Financial clarity takes design, too. We build tools to understand cash flow, analyze costs and turn scattered data into decisions.
Your numbers, in perspective.
Compare money in and money out to plan your business liquidity.
Budgets, reconciliations and metrics connected to your business reality.
Let's explore my dashboardA useful dashboard starts with a decision, a reliable source and someone responsible for acting.
From recurring reports to a shared view
When every meeting begins with reconciling spreadsheets, a dashboard can help create a consistent view. The first job is understanding where the data comes from, what each measure means and what people do with the result.
We work on Power BI dashboards, financial analysis and business reporting. Together, we define the audience, business questions and available sources before selecting charts.
Is it for you?
Five situations we see often. Tick the ones that happen to you.
Tick what happens to you. One or two is already worth a conversation.
What a dashboard project can include
The final scope depends on access to data and the way your team works. Common areas are:
- Review of data sources, definitions and refresh needs.
- A model and measures built around agreed business questions.
- Clear views for the people who need to make decisions.
- Permissions, validation and documentation within the agreed scope.
How much does building the report by hand cost?
Count the hours of everyone who touches the report each week.
- Hours a month on that task
- 35 h
- What that time costs a year
- $3,325
- The Starter dashboard package ($135) is covered in
- less than a month
The starter dashboard starts from a clean source. If data needs cleaning first, that work is quoted separately and we tell you beforehand.
Get a quote with these numbersWhat the Starter dashboard package includes
1 structured source, 1 page, up to 5 indicators and filters. Documented manual refresh.
Configuration, testing, training and a user guide.
Generate a narrative summary of the 5 indicators, subject to review.
The total with AI replaces the base price; it is not added.
No complex integration or branch-level permissions.
Taxes, licenses, usage and information preparation are quoted separately.
- Extra page on the same model+$80
- 5 more indicators+$85
- Related new source+$135
- Scheduled refresh+$100
Start with one recurring decision
Choose a meeting or decision that repeatedly requires manual preparation. Bring sample field names, an explanation of your sources and the questions you cannot answer easily. Avoid sharing personal or confidential data in the initial inquiry.
A small, well-defined first version helps the team evaluate usefulness before adding more views. Cost and delivery depend on the sources, complexity and agreed scope; the package published on this page is the starting point.
How we work
- 01A free first 30-minute conversation
We understand your goal and how you work today. You leave with a recommendation even if you do not hire us.
- 02Scope and fixed price in writing
What is included, what is not and how much it costs, before starting. No surprises at the end.
- 03Progress every 72 hours in your client portal
Every client gets access to a portal with stages, progress, deliverables to approve, documents and meetings.
- 0430 days of support after delivery
We fix defects within the delivered scope at no cost. After that, optional monthly support.
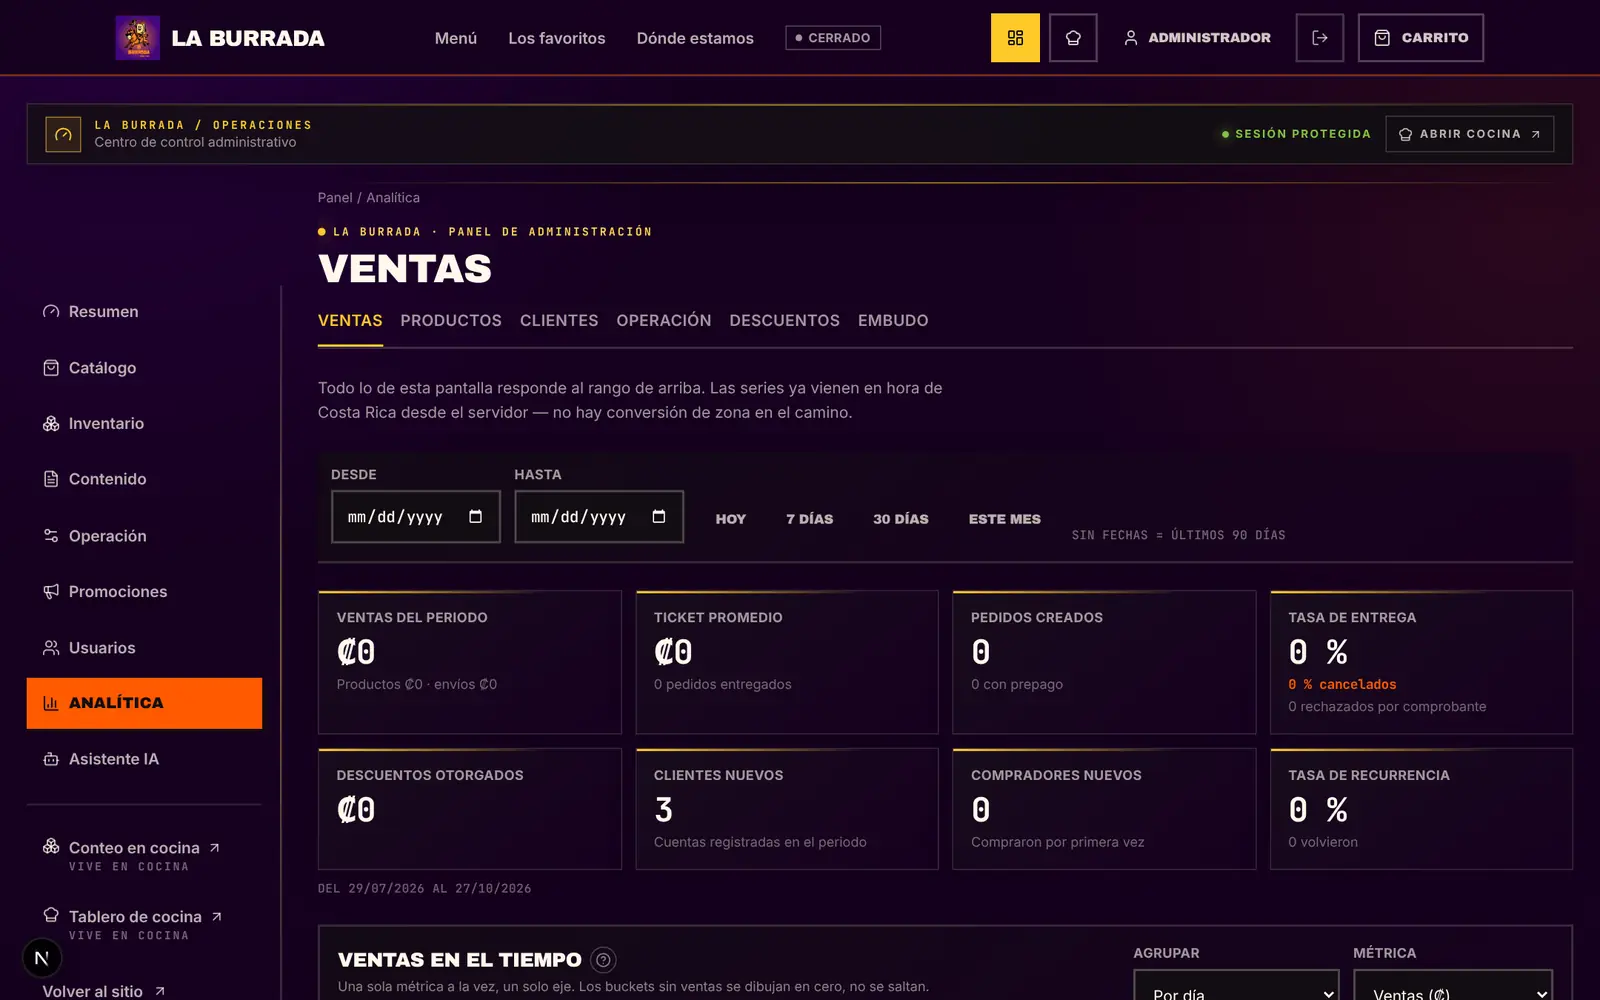
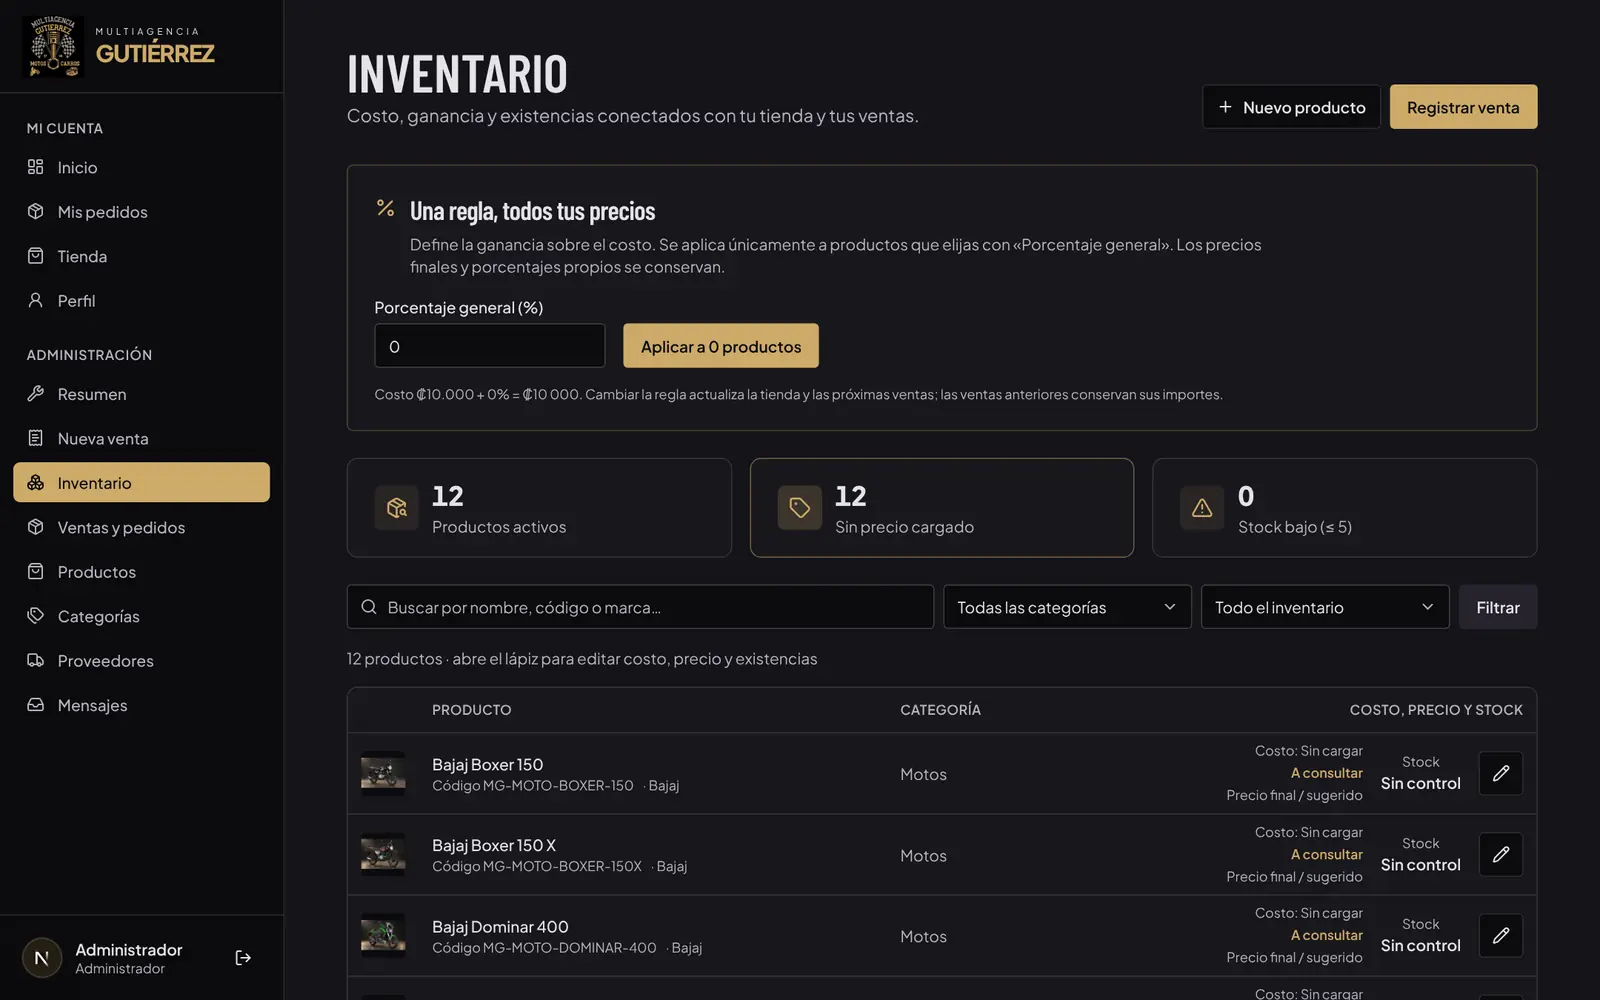
A real example
A real screen from a system that exists, with demo data.
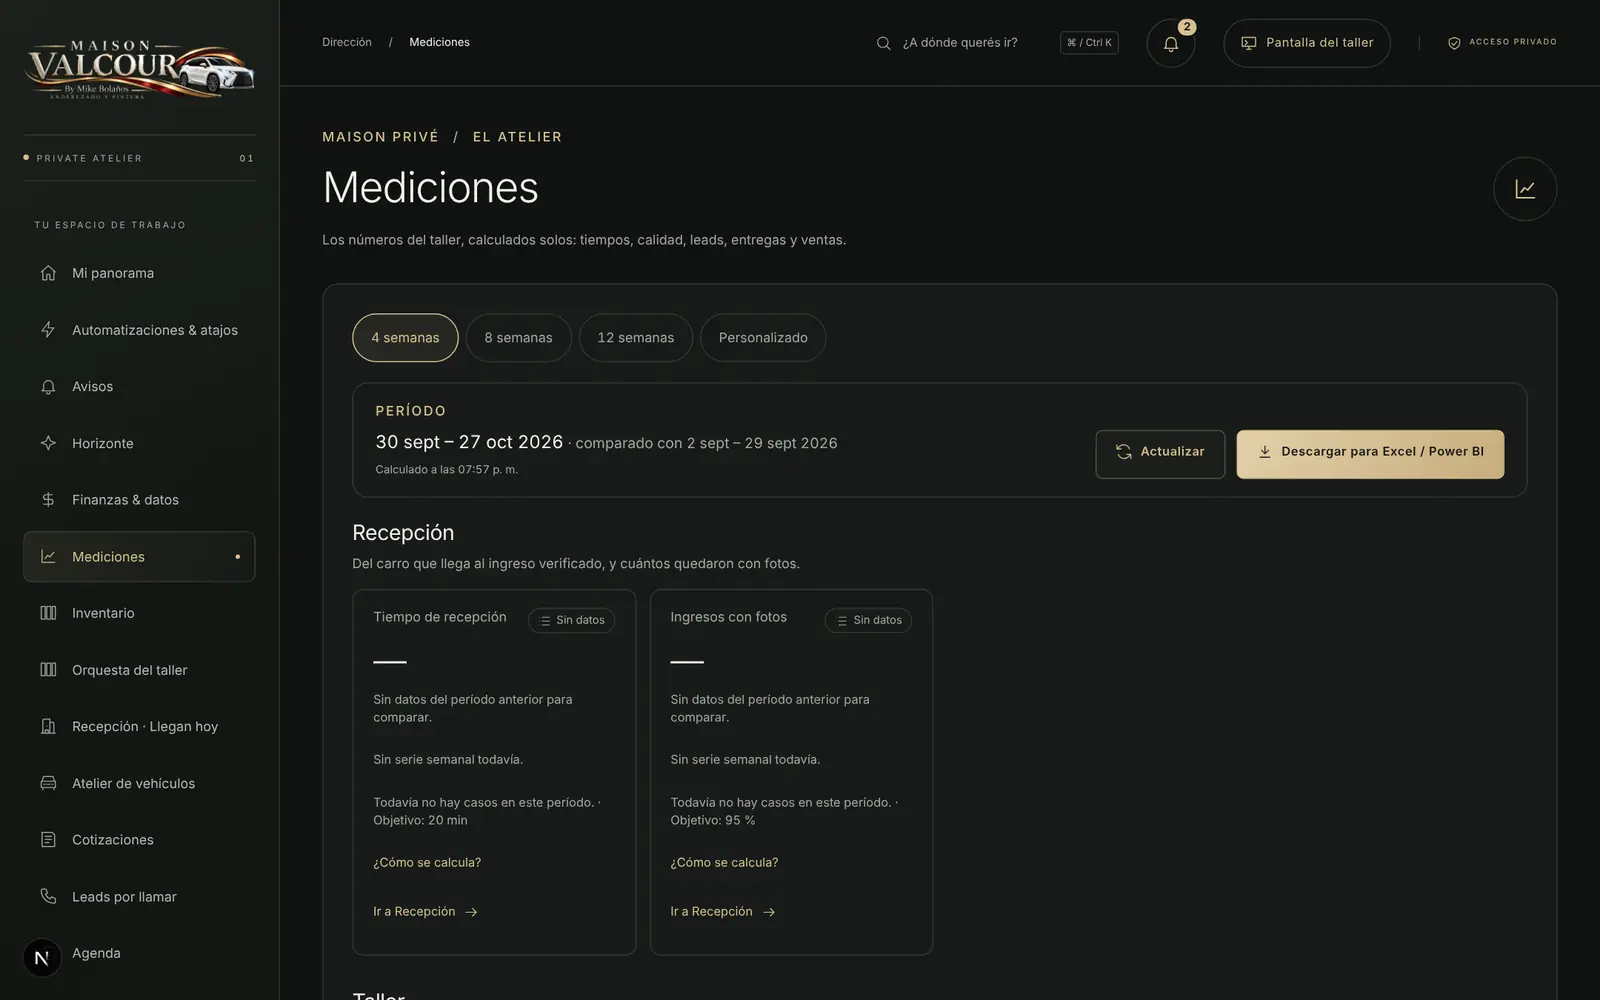
Taller Maison Valcour
We don’t just paint. We restore prestige.
- 3D quote tool on GLB models with a 2D fallback; the same pricing engine validates on the server
- Scroll film with canvas frames and video quality chosen by network speed
Frequently asked questions
01Do I need to pay for Power BI?
The starter dashboard works with your files and needs no licenses. The management Power BI publishes to Microsoft’s service, and those licenses are quoted separately.
02What data do you need?
One clean source: a spreadsheet, a system with an export or a database. If the data is messy, we offer cleaning at a published price.
03Does it refresh on its own?
The base includes a documented manual refresh. Scheduled refresh is an add-on with a fixed price.
04What if I want more indicators later?
They are added in blocks of five, at a published price. We prefer to start with the ones that support one concrete decision.
Bring the question to your team.
Three questions to explore together. Open one and use it to start a conversation.
01What decision should this dashboard improve?
Write down a specific situation, listen to another perspective and agree on a small next step. If you would like an outside perspective, we can talk it through.
Discuss with the studio02Which number does your team interpret differently today?
Write down a specific situation, listen to another perspective and agree on a small next step. If you would like an outside perspective, we can talk it through.
Discuss with the studio03Who acts when an indicator changes?
Write down a specific situation, listen to another perspective and agree on a small next step. If you would like an outside perspective, we can talk it through.
Discuss with the studioTell us about your case.
We reply within 24 hours.
You can continue on WhatsApp with the message ready, or leave your contact and we write to you. Both options reach the same team.
 Guide + tool